
Key facts
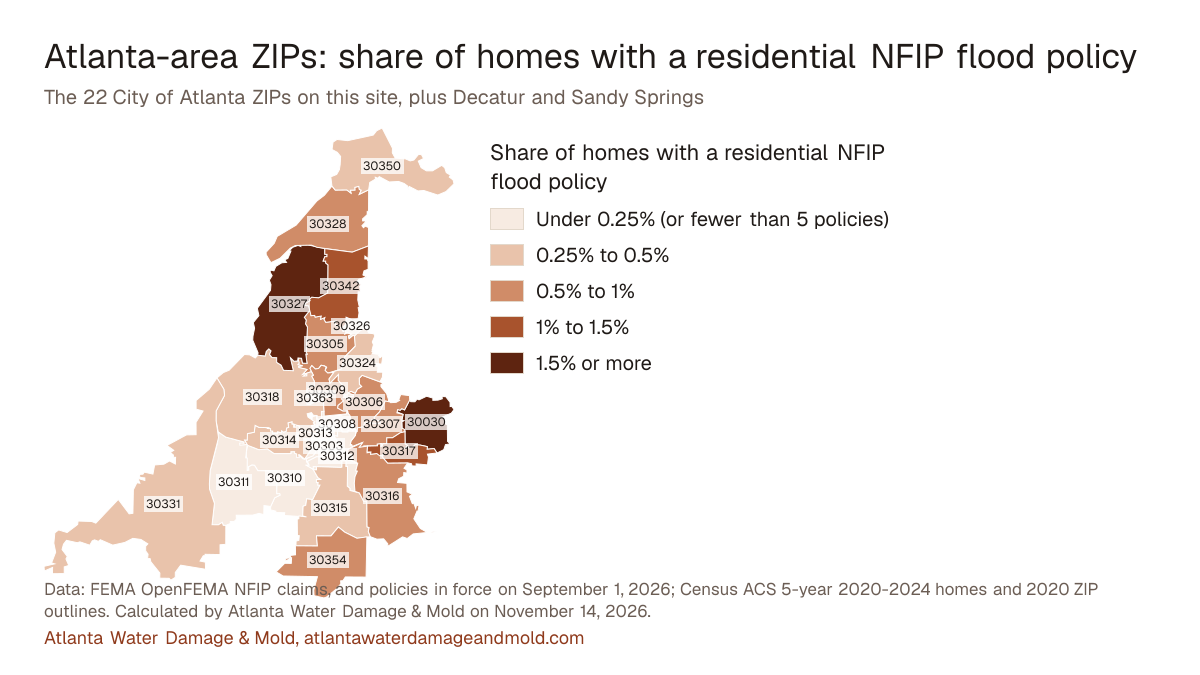
- Only about 0.6% of the 358,853 homes in the 25 Atlanta, Decatur and Sandy Springs ZIP codes on this map carried a residential NFIP flood policy on September 1, 2026: 2,003 policies in all (calculated by Atlanta Water Damage & Mold on November 14, 2026). FEMA OpenFEMA NFIP Redacted Claims and Policies v3
- ZIP 30327 has the largest share of homes carrying an NFIP policy, 2.63% on September 1, 2026 (calculated by Atlanta Water Damage & Mold on November 14, 2026). FEMA OpenFEMA NFIP Redacted Claims and Policies v3
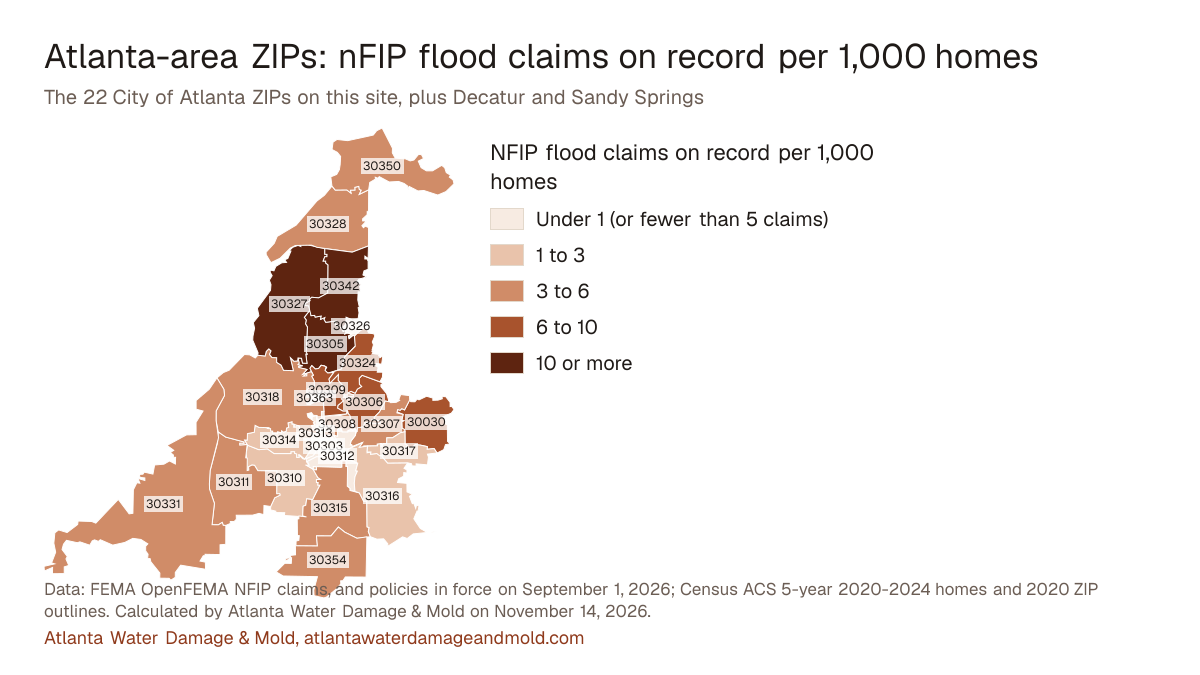
- FEMA lists 2,818 NFIP flood claims in these ZIPs with $92,020,968 paid on buildings and contents; ZIP 30327 accounts for 764 of them, more than any other (calculated by Atlanta Water Damage & Mold on November 14, 2026). FEMA OpenFEMA NFIP Redacted Claims and Policies v3
- Set against the number of homes, ZIP 30327 leads with about 73.8 claims on record per 1,000 homes (calculated by Atlanta Water Damage & Mold on November 14, 2026). FEMA OpenFEMA NFIP Redacted Claims and Policies v3
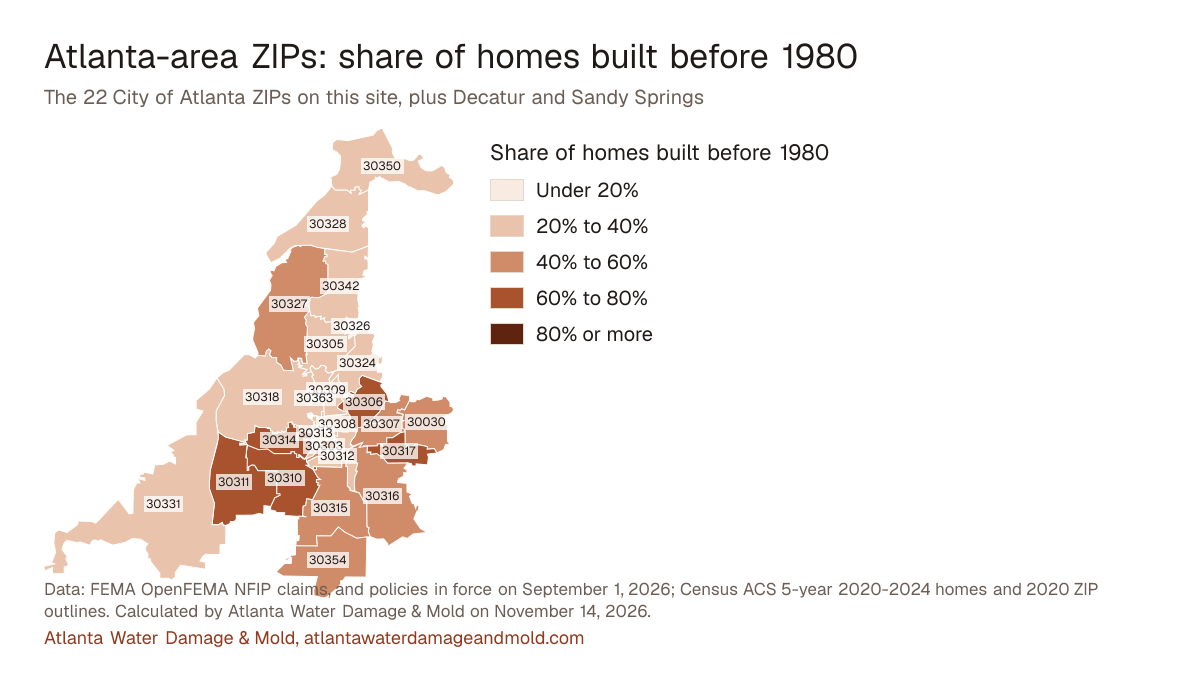
- About 42% of homes in the 22 City of Atlanta ZIP codes here were built before 1980, by Census estimates for ACS 5-year 2020-2024 (calculated by Atlanta Water Damage & Mold on November 14, 2026). U.S. Census Bureau ACS, tables B25034 and B25035
The map
Among ZIPs with at least 5 policies, the share of homes with flood insurance runs from 0.04% in 30308 to 2.63% in 30327. Use the buttons to switch what the colors show; every number is in the table below the map.
Share of homes with a residential NFIP flood policy
- Under 0.25% (or fewer than 5 policies)
- 0.25% to 0.5%
- 0.5% to 1%
- 1% to 1.5%
- 1.5% or more
NFIP flood claims on record per 1,000 homes
- Under 1 (or fewer than 5 claims)
- 1 to 3
- 3 to 6
- 6 to 10
- 10 or more
Share of homes built before 1980
- Under 20%
- 20% to 40%
- 40% to 60%
- 60% to 80%
- 80% or more
Data: FEMA OpenFEMA NFIP claims, and policies in force on September 1, 2026; Census ACS 5-year 2020-2024 homes and 2020 ZIP outlines. Calculated by Atlanta Water Damage & Mold on November 14, 2026. Save the map as an image, one per measure: flood policies per home, claims per 1,000 homes, homes built before 1980.
What these numbers can and can't tell you
Claims and policies are National Flood Insurance Program records only; private flood policies, homeowners insurance water claims and uninsured losses aren't in them. Policies are residential NFIP policies in force on September 1, 2026. One policy can cover a building with several homes and a renter can hold a contents-only policy, so policies per home is a rough measure. ZIP codes are the ones reported to FEMA, and a ZIP with fewer than 5 claims or policies shows "fewer than 5" with no dollar total or share. Homes and their ages are Census ACS 5-year 2020-2024 estimates for ZIP Code Tabulation Areas, which approximate USPS ZIP codes and carry margins of error. The share in Atlanta is by land area, so a ZIP that crosses the city line also counts homes in Sandy Springs, unincorporated DeKalb or other neighbors.
All 25 ZIPs, one table
ZIP 30327 has the most claims (764) and ZIP 30327 the largest total paid ($41,805,549). Of the 2,818 claims, 2,282 ended with a payment.
| Area | |||||||
|---|---|---|---|---|---|---|---|
| 30327 | AreaBuckhead and north Atlanta (64% of its land in Atlanta) | NFIP claims764 | Total paid$41,805,549 | Flood policies in force272 | Homes with a policy2.63% | Median year built1984 | Built before 198043% |
| 30342 | AreaBuckhead and north Atlanta (46% of its land in Atlanta) | NFIP claims488 | Total paid$9,893,583 | Flood policies in force218 | Homes with a policy1.37% | Median year built1992 | Built before 198032% |
| 30305 | AreaBuckhead and north Atlanta (100% of its land in Atlanta) | NFIP claims265 | Total paid$8,761,720 | Flood policies in force122 | Homes with a policy0.67% | Median year built1991 | Built before 198036% |
| 30309 | AreaDowntown and Midtown (100% of its land in Atlanta) | NFIP claims186 | Total paid$12,873,781 | Flood policies in force114 | Homes with a policy0.53% | Median year built2002 | Built before 198026% |
| 30030 | AreaDecatur | NFIP claims133 | Total paid$1,083,596 | Flood policies in force228 | Homes with a policy1.52% | Median year built1978 | Built before 198052% |
| 30328 | AreaSandy Springs | NFIP claims117 | Total paid$1,408,936 | Flood policies in force131 | Homes with a policy0.64% | Median year built1989 | Built before 198035% |
| 30324 | AreaBuckhead and north Atlanta (76% of its land in Atlanta) | NFIP claims114 | Total paid$4,293,403 | Flood policies in force70 | Homes with a policy0.38% | Median year built1998 | Built before 198023% |
| 30318 | AreaWestside (100% of its land in Atlanta) | NFIP claims104 | Total paid$2,250,418 | Flood policies in force83 | Homes with a policy0.26% | Median year built2001 | Built before 198037% |
| 30306 | AreaEastside (75% of its land in Atlanta) | NFIP claims99 | Total paid$1,684,464 | Flood policies in force114 | Homes with a policy0.93% | Median year built1956 | Built before 198064% |
| 30331 | AreaSouthwest Atlanta (49% of its land in Atlanta) | NFIP claims97 | Total paid$1,090,146 | Flood policies in force94 | Homes with a policy0.35% | Median year built1992 | Built before 198036% |
| 30308 | AreaDowntown and Midtown (100% of its land in Atlanta) | NFIP claims88 | Total paid$2,307,489 | Flood policies in force6 | Homes with a policy0.04% | Median year built2001 | Built before 198033% |
| 30311 | AreaSouthwest Atlanta (100% of its land in Atlanta) | NFIP claims74 | Total paid$729,349 | Flood policies in force37 | Homes with a policy0.22% | Median year built1968 | Built before 198070% |
| 30350 | AreaSandy Springs | NFIP claims60 | Total paid$1,354,275 | Flood policies in force72 | Homes with a policy0.37% | Median year built1986 | Built before 198025% |
| 30315 | AreaSouth Atlanta (99% of its land in Atlanta) | NFIP claims52 | Total paid$614,402 | Flood policies in force56 | Homes with a policy0.35% | Median year built1976 | Built before 198055% |
| 30307 | AreaEastside (62% of its land in Atlanta) | NFIP claims41 | Total paid$386,610 | Flood policies in force58 | Homes with a policy0.55% | Median year built1968 | Built before 198054% |
| 30354 | AreaSouth Atlanta (63% of its land in Atlanta) | NFIP claims34 | Total paid$444,845 | Flood policies in force62 | Homes with a policy0.82% | Median year built1975 | Built before 198056% |
| 30316 | AreaEastside (29% of its land in Atlanta) | NFIP claims31 | Total paid$150,254 | Flood policies in force96 | Homes with a policy0.52% | Median year built1976 | Built before 198054% |
| 30314 | AreaWestside (100% of its land in Atlanta) | NFIP claims28 | Total paid$273,355 | Flood policies in force28 | Homes with a policy0.29% | Median year built1966 | Built before 198066% |
| 30310 | AreaWestside (100% of its land in Atlanta) | NFIP claims15 | Total paid$260,829 | Flood policies in force17 | Homes with a policy0.12% | Median year built1957 | Built before 198068% |
| 30317 | AreaEastside (89% of its land in Atlanta) | NFIP claims12 | Total paid$47,051 | Flood policies in force100 | Homes with a policy1.38% | Median year built1960 | Built before 198060% |
| 30312 | AreaEastside (100% of its land in Atlanta) | NFIP claims12 | Total paid$274,895 | Flood policies in force22 | Homes with a policy0.14% | Median year built2002 | Built before 198030% |
| 30303 | AreaDowntown and Midtown (100% of its land in Atlanta) | NFIP claimsfewer than 5 | Total paidNot shown | Flood policies in forcefewer than 5 | Homes with a policyNot shown | Median year built1967 | Built before 198059% |
| 30363 | AreaDowntown and Midtown (100% of its land in Atlanta) | NFIP claimsfewer than 5 | Total paidNot shown | Flood policies in forcefewer than 5 | Homes with a policyNot shown | Median year built2006 | Built before 19802% |
| 30326 | AreaBuckhead and north Atlanta (100% of its land in Atlanta) | NFIP claimsfewer than 5 | Total paidNot shown | Flood policies in forcefewer than 5 | Homes with a policyNot shown | Median year built2007 | Built before 19802% |
| 30313 | AreaDowntown and Midtown (100% of its land in Atlanta) | NFIP claimsfewer than 5 | Total paidNot shown | Flood policies in forcefewer than 5 | Homes with a policyNot shown | Median year built2003 | Built before 198027% |
Source: FEMA OpenFEMA NFIP Redacted Claims v3 and NFIP Redacted Policies v3; U.S. Census Bureau ACS 5-year 2020-2024, tables B25034 and B25035; calculated by Atlanta Water Damage & Mold on November 14, 2026. Paid totals combine building and contents payments. See sources and methods. This product uses the Federal Emergency Management Agency's OpenFEMA API, but is not endorsed by FEMA. The Federal Government or FEMA cannot vouch for the data or analyses derived from these data after the data have been retrieved from the Agency's website(s).
Years with the most claims
- 2009598 claims, $37,524,135 paid
- 2004371 claims, $15,386,754 paid
- 2024271 claims, $19,979,986 paid
- 1979182 claims, $741,001 paid
- 1990146 claims, $3,192,771 paid
The year is FEMA's year of loss. Every year, and the storms behind the big ones, are on the Atlanta flooding history page.
For one address's flood zone, use FEMA's Flood Map Service Center or call Atlanta's floodplain office at 404-546-3291 for an official floodplain letter. Outside water needs a flood policy rather than homeowners insurance; see flood insurance in Atlanta and the flood damage restoration page. Older homes matter for tear-out too: in a house built before 1978, ask about lead-safe work before painted walls are cut.
Cite this page: “Atlanta Flood Map by ZIP: Claims, Policies and Home Age.” Atlanta Water Damage & Mold, https://atlantawaterdamageandmold.com/atlanta-flood-map-by-zip/. Updated November 14, 2026.